Following on from the blog post last summer, The National Archives has been working with statisticians from the University of Warwick and partners from five other UK archives to develop a model that quantifies the risks to digital preservation. This has been done using a Bayesian network – an advanced statistical technique that considers the dependencies between risk events, e.g. the risk of hardware obsolescence depends on the storage medium used.
We now have a complete model and prototype web-based tool for digital archivists to use.
Creating the model
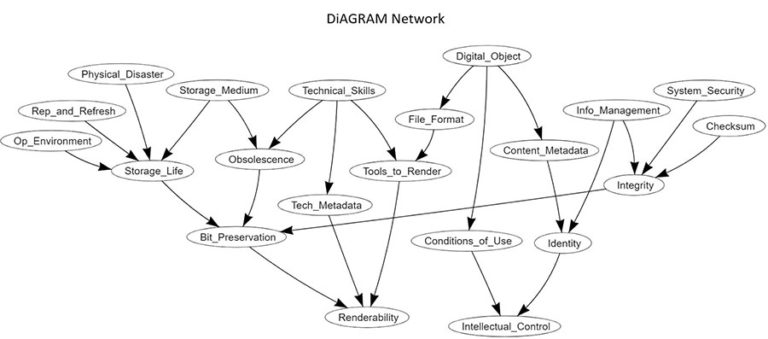
To build the model, we first had to identify the key risks to digital preservation and how they related to one another. This began as a brainstorming exercise with lots of sticky notes on walls and ended up as a mathematical network. Through discussions on scope, debates about semantics and careful logical thought, this network evolved and finally settled into what we have today:

Each of these 21 variables (or nodes) has a very precise definition in the model. For instance, ‘Tools_to_Render’ is defined as ‘Availability of tools and software to render the digital material and the expertise to use them’ and has two states it can take: ‘yes’ and ‘no’. We know that in reality most institutions will not be perfect but they might be doing something, therefore all of the nodes are given as probabilities, to reflect that there is a scale between the extremes of being very vulnerable to this threat and fully mitigated against it.
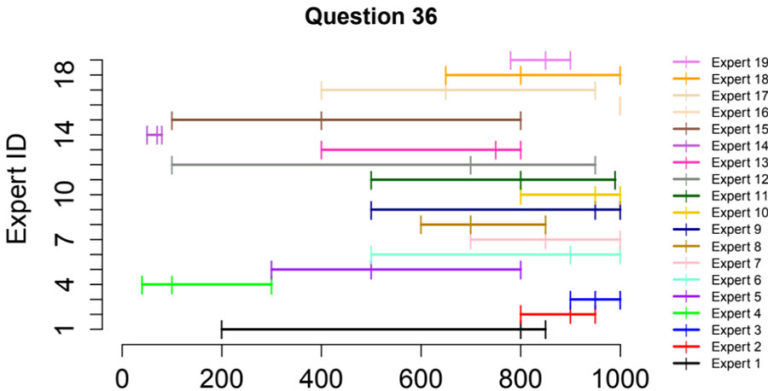
Most of the probabilities used in the foundations of the model came from a structured expert judgement workshop. This involved experts quantifying uncertainty of variables relating to digital preservation risks, then results were carefully combined to maximize the statistical accuracy and informativeness of the final data. A blog post explaining the protocol that was followed can be found here: Who to Trust? The IDEA Protocol for Structured Expert Elicitation.

Making it usable
From the start, we had to consider how to produce something which archivists would find usable and would want to use – all the hard work that went into building the complex model would be pointless if it only ever exists in statistical code. We therefore decided to build an application which takes the user through a series of steps to help them quantify the risk for their archive, and test the impact that different policies may have.
Fortunately our colleagues at Warwick had two placement students from Monash University, Australia, who were able to design and build a Graphical User Interface for the tool (and luckily managed to return to the other side of the world just before COVID-19 hit the UK!). Since then, we have made a few changes based on feedback, and we are hoping to give the tool a final makeover at the end of the summer before we officially launch the first version.

The main output from the model is a digital preservation risk score which is currently calculated based on the probability of having renderability and intellectual control, the two digital preservation outcomes as identified by the project team. As with all terms used in the model, renderability and intellectual control have very particular definitions. Every model and scenario will produce a risk score, which archivists can use to quantitatively compare the impacts changing policies will have on their risk.

For the next few months we are going to be working on our own metadata for the project, to ensure we have comprehensive guidance on how to use the tool and on the methodologies and data behind it. We are also holding virtual workshops with the Digital Preservation Coalition (the material from the first workshop can be found on the event page) and will be holding more online presentations and webinars once the final model is complete.
This project is supported by the National Lottery Heritage Fund and the Engineering and Physical Sciences Research Council.
To find out more, see the project’s web page, Safeguarding the nation’s digital memory.