Maps have often been studied from a historical and geographical point of view, but attention has rarely been drawn to their materiality. Recently, initiatives like the exhibition ‘When artists drew maps’ at the French National Archives and the symposium ‘Maps and Colours’ at the University of Hamburg have started to change the way we think about maps. These initiatives have focused on the painting techniques, use of colour and materials deployed by map-makers in the past, about which we know very little in comparison to the production context of easel paintings or illuminated manuscripts, for instance.
The National Archives holds one of the world’s largest collections of historical maps (more than six million items), ranging from the 14th century to the present day. They cover every corner of the British Isles, as well as places all around the globe where the British government had strategic interests, particularly during the colonial period.
The earliest maps are manuscripts, often colourful, and some reveal the remarkable artistic skills of the people who made them. They offer researchers a great opportunity to investigate the materials and techniques of these mapmakers.
As a starting point, we focused on a series of maps of Ireland made during the Tudor conquest of the island in the 16th and 17th centuries, some of which are signed by known mapmakers such as Robert Lythe, John Browne, Richard Bartlett or Josias Bodley.
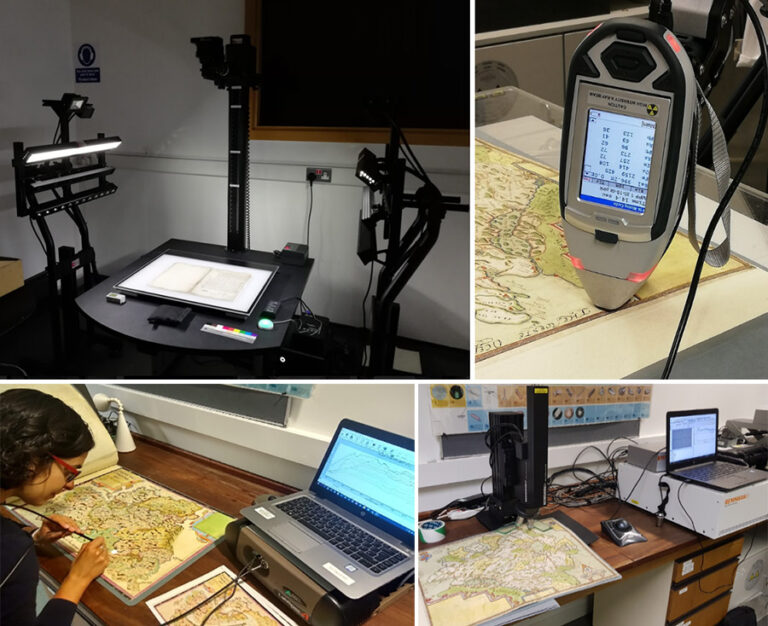
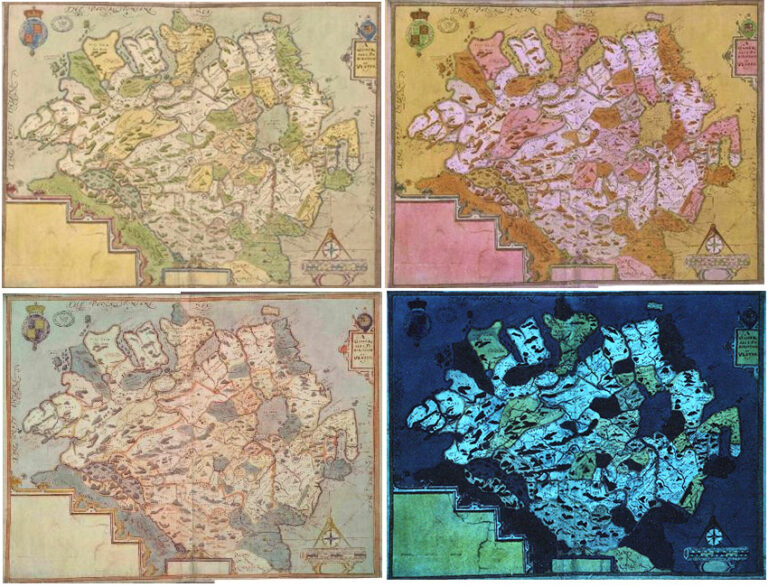
The analysis of Richard Bartlett’s vibrantly coloured maps of Ulster using a range of non-invasive techniques (multi-spectral imaging, microscopy, X-ray fluorescence and Raman spectroscopies), revealed that he was using a varied and sophisticated colour palette, including many organic dyes, such as reds extracted from scale insects (like kermes or cochineal) for pink tones and transparent glazes. Also evident were some expensive materials like gold ink or unusual pigments like an orange-yellow synthetic arsenic sulphide glass, the earliest instance identified in a British artwork.
Analysis of the materials was also helpful in understanding the condition and degradation of some pigments, such as the darkening of red lead in the forts and churches represented in the map that would have looked orange originally instead of black.
The next step was to compare the materials and techniques identified in Bartlett’s maps with those of other cartographers from the period, to shed light on the particularities, influences and evolution of mapmaking in Tudor England. Were the mapmakers’ palettes similar or distinctive? Could we use the identified materials and techniques to attribute authorship? Had they access to their predecessors’ cartographic work? Can we speak of a certain standardisation of the profession? Do the identified materials coincide with those recommended in painting treatises of the period? Do the materials reflect the function and status of the map?
To address these questions we have to systematically analyse as many maps as possible, which is time-consuming and generates large and complex data sets. This is typical of heritage science – in archives and libraries – that has to deal with series of documents at mass-scale, while in museums and galleries we usually focus on the analysis of a single or a few iconic objects. Therefore, automation of data acquisition and processing becomes especially important in an archive setting.
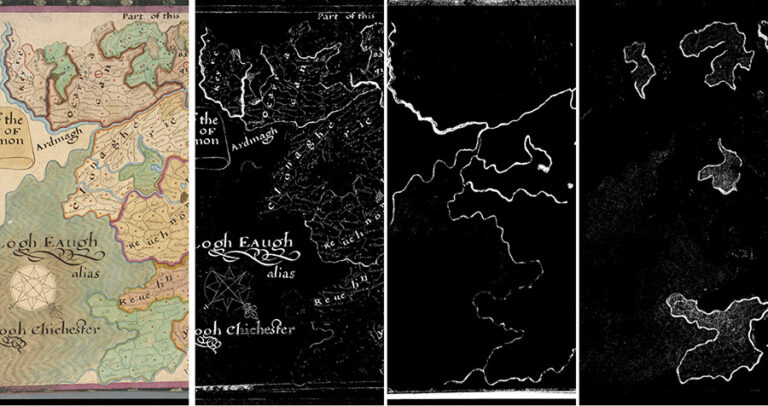
This is the goal of our participation in the AHRC-funded project ‘AI for Digilab’, led by imaging scientists from the ISAAC group at Nottingham Trent University. The National Archives uses an automated multi-spectral imaging system to rapidly capture images of the Irish maps under different types of radiation (ultraviolet, visible and infrared). Spectral data is then extracted pixel-by-pixel from the images by the ISAAC team and analysed with an unsupervised clustering algorithm, which locates areas in the image that share similar material composition.
These automatically produced clusters of similar pigments are incredibly helpful to select the areas for complementary spot-analysis to identify accurately the pigments in the map, speeding up the whole process and allowing us to analyse more maps more efficiently.
A visualisation tool with which to compare material clusters across images is also being developed, and the final aim of ‘AI for Digilab’ is to integrate these tools in an online platform within the European Research Infrastructure for Heritage Science (E-RIHS), as a remote spectral imaging data analysis and visualisation lab, democratising access to these technologies.