Any researcher interested in working with historical data knows that the most difficult and time-consuming part of the process is invariably the data capture.
Nowhere is this more apparent than with datasets based upon archival sources. Transcribing, cleaning and structuring data to turn it into something usable can be immensely time-consuming, something that frequently means researchers either do not take advantage of new digital perspectives, or focus on printed and OCRed sources.
What most of us forget is that we use vast historical datasets every day in our research – we simply call these archive catalogues, and rarely give them a second thought.
In fact they represent a huge set of structured data on diverse historical topics and offer great opportunities for research and teaching using digital tools.
So what do I mean when I say that the catalogue is data? Well, let us take a clear example. SC 8 is a series of petitions addressed to the King, the council or other officers of state focusing mainly on the later medieval period. These have been catalogued, providing a considerable level of detail for each petition and formatted in a highly structured way. The entry below gives you a good idea of the type of information contained and the manner in which it is arranged.
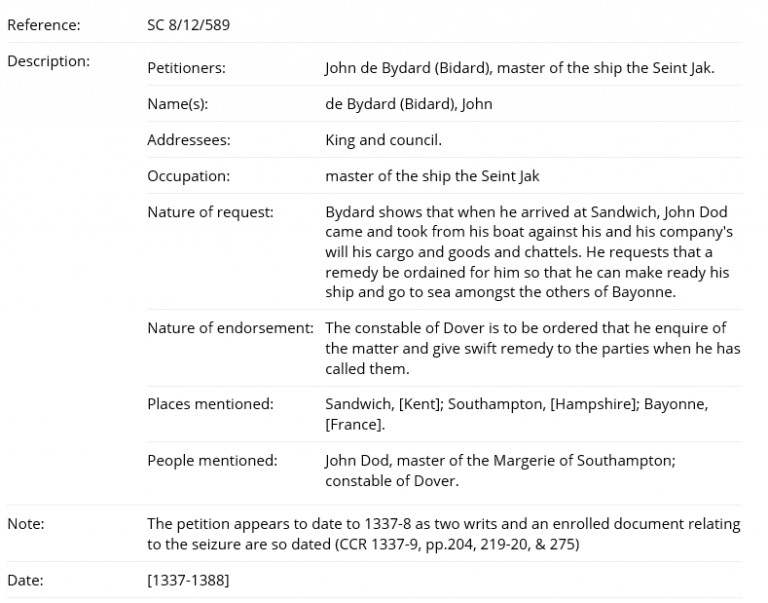
SC 8 catalogue description
The National Archives’ catalogue contains just under 18,000 descriptions of this type within the series SC 8, providing what is potentially a huge and easily accessible data set for research on medieval England.
The next obvious question is: how do we get the data out of the catalogue and into a form where we can start to use it?
The first step is to go into Discovery and identify the section of records you are interested in. For this example, I am using SC 8 for the years 1360 to 1380.
Using the filters on the right-hand side, I can narrow down to only show item-level descriptions (ie, individual petitions).
This leaves me with just under 1800 results, which I will sort by the reference to put them in an archival order and then export. Note that you can only export up to 10,000 results and to build a bigger data set you will need to export it in chunks.
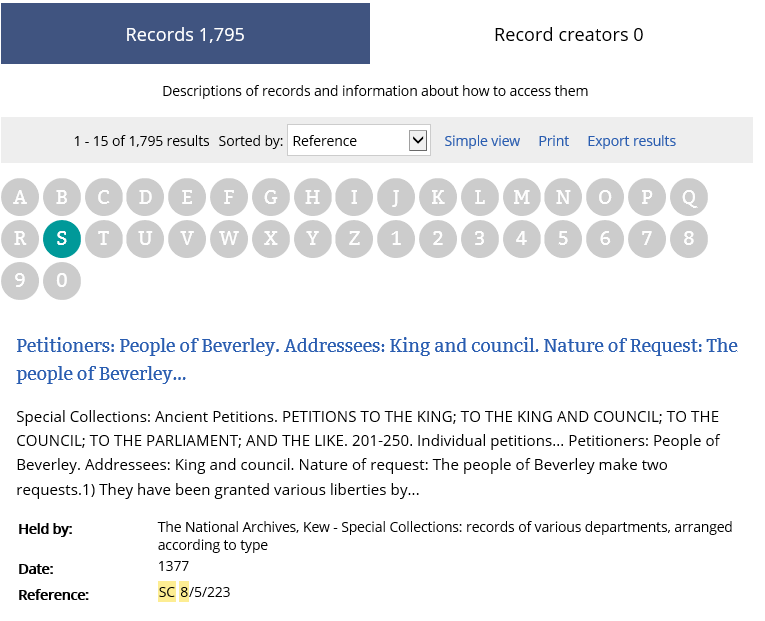
Screenshot from Discovery
The results will be exported as a CSV file. This can initially look a little overwhelming, but there is a lot of information that we can get rid of straightaway to make our data more manageable. The key columns we need are “Citeable Reference”, “Description”, “Covering Dates” and “ID”.
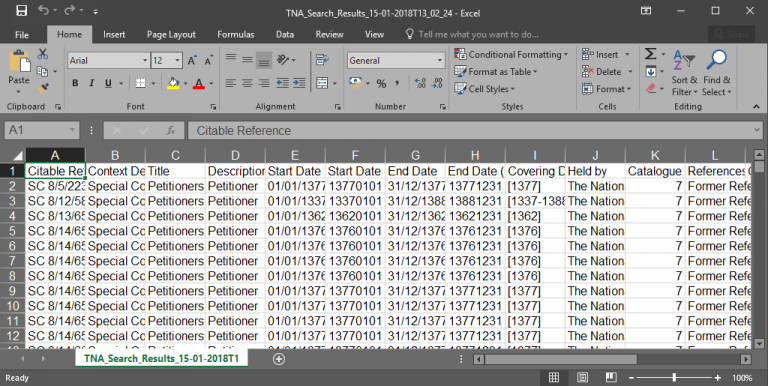
Initial CSV Export
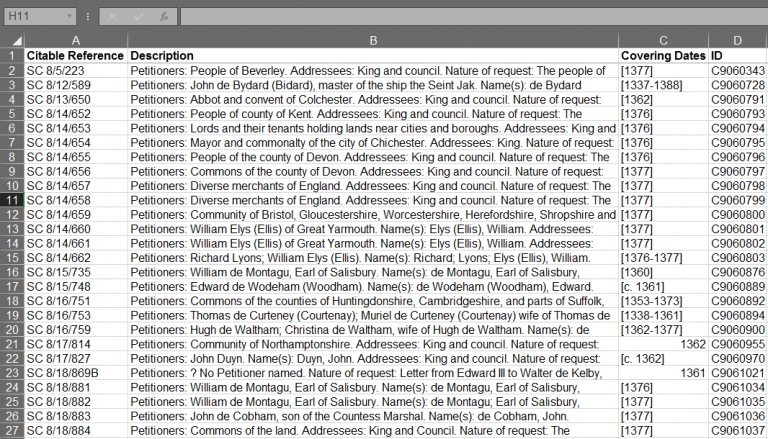
The key information
With this done we can now focus our attention on the “Description” column. Unfortunately, much of the information that was so nicely separated out into categories within the catalogue has been lumped together in this column.
To use the data meaningfully we now need to split it back out. This can be done easily using a tool such as OpenRefine, but it is possible to do it in regular spreadsheet software such as Excel.
All you need to do is use the “Find and Replace” tool to replace the titles (ie, Petitioners or Addressees) with an unusual symbol such as “|” and use the “Split to Columns” tool to separate out the data. It tends to be best to do this in stages as you can spot any inconsistencies and correct these manually.
I went through this process and after a little bit of work produced a spreadsheet with new columns containing the petitioners, their occupation, the addressee of the petition, the nature of the request, the nature of the endorsement, places mentioned and people mentioned.
These fields give me plenty of scope to begin to explore the data at a scale that would have never been possible by looking at the petitions individually.
By way of example we can start by looking for counties named in the “places mentioned” column. The chart below simply counts the number of petitions in which the counties are mentioned; a very simple graph, but one that begins to give us an idea of the geographic spread of our data. From here we could start to map the density of petitions.
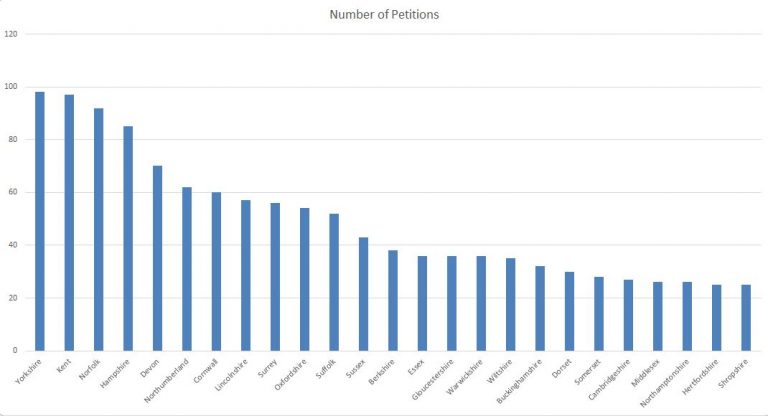
Geographical distribution of Petitions
Similarly we can begin to ask questions about who our petitions were addressed to, using the data in the addressee column. The graphic below shows the break down of the most common addressees for the total dataset.
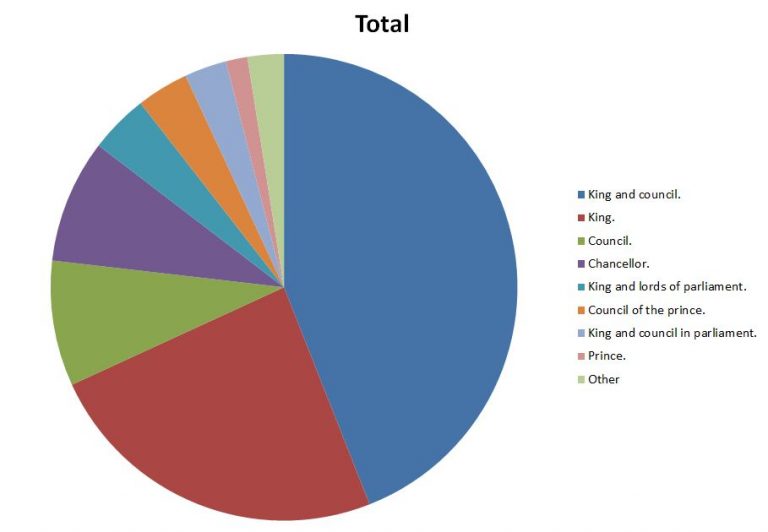
Addressees
We can take this a little further and start to think about how this might change over time. The dating of these petitions is vague, but by producing a median date for each petition we can at least get a sense of change over time. The graphics below show the petitions with a median date before and after 1370.
They show a clear shift in the pattern of addressees, with the earlier period showing a greater weighting towards the King and the King and Council, whilst later on there is a far greater diversity of addressees.
This does not come as a surprise considering the history of the period, nonetheless it is interesting to see it demonstrated in this form.
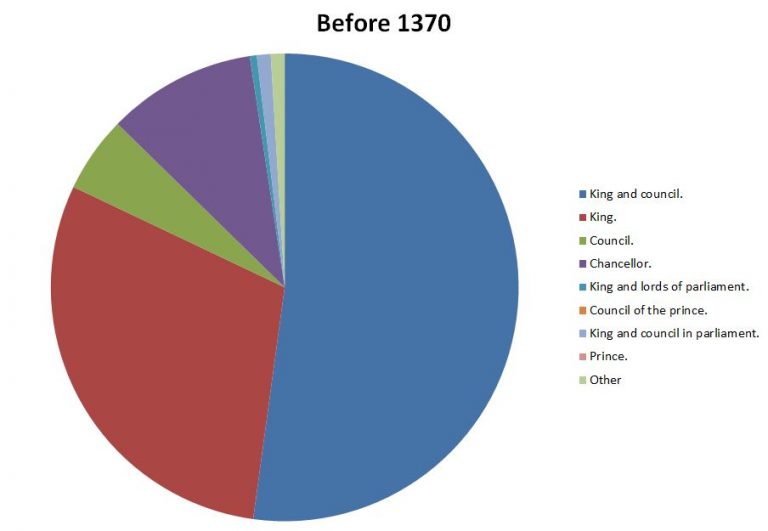
Addressees before 1370
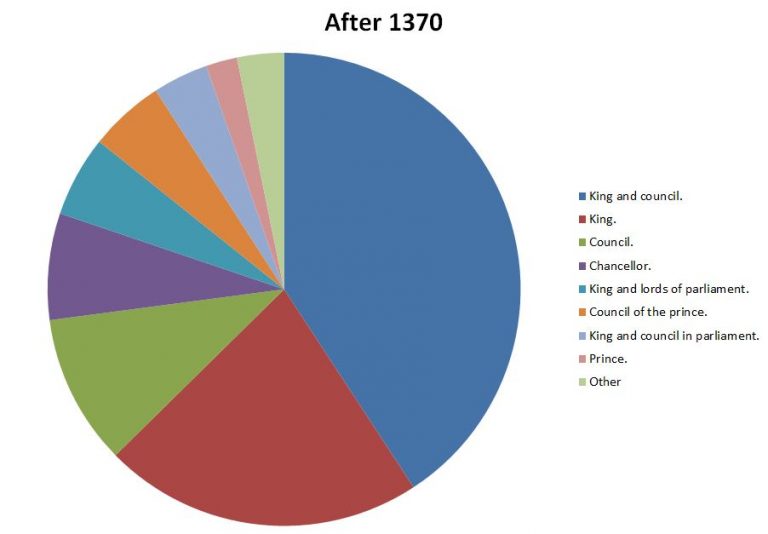
Addressees after 1370
The above are only very simple graphics and much more can be done with this data. Hopefully, however they demonstrate the ease with which one can go from catalogue to usable data.
In The National Archives’ catalogue alone there are numerous series across time periods and subject matter where this could be done. This represents an amazing and under-utilised resource for research and teaching, and above all, one which is free and universally accessible.
In my next blog I will continue with this theme and look in a little bit more detail at what you can do with data extracted from the catalogue, making use of our collection of High Court of Admiralty Prize papers.
Read the second post in this series: Catalogue as Data: the Prize Papers from the 2nd Anglo-Dutch War.
As the PI on the project that made these data points possible, I would like to acknowledge AHRC for funding the work – TNA analysis would have been impossible without it.
Very interesting. I wonder if TNA should include data quality advice if this approach becomes seen as useful (as I hope it does)