Evidence of the relationships between people, both personal and professional, can be found all over The National Archives. Correspondence, disputes and contracts all offer valuable information about how people worked (or failed to work) together! Much of this information is hidden within the text of individual records and requires meticulous examination to discover. However, some records present this information in a much simpler and more uniform manner.
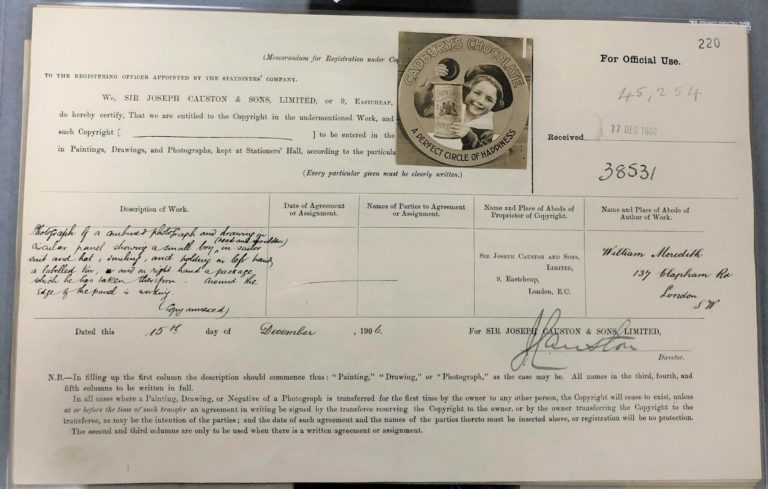
Records of copyright are particularly useful from this perspective. The COPY 1 record series contains entry forms which were submitted to the Stationers’ Company to register copyright for an item of creative work. Each record contains details of the copyright owner and the copyright author of the creative work, presenting a clear professional relationship in one sheet of paper. A large quantity of this material (specifically photographs registered for copyright between 1862 and 1910) has been catalogued, meaning that details of these professional relationships can be found directly in our online catalogue. At a time when examining original records in the archive is impossible, detailed catalogue data presents a fantastic opportunity for quantitative research using digital methods.
Network analysis
The simple copyright owner to copyright author relationships evidenced in the catalogue renders the COPY 1 series perfect for research using the method of network analysis.
Network analysis refers to a set of techniques to analyse and visualise connections between individual actors or things, usually through a network graph. These techniques are often used to present and analyse social structures and have been employed in a wide variety of disciplines.
A network graph consists of nodes (which represent the individual actors or things in the network) connected together by edges (which represent the relationships between the nodes). When applied to our copyright catalogue data, we can produce a network graph which visualises the professional relationships between people (copyright owners and authors).
Among the copyright entry forms in the COPY 1 record series, there are almost 130,000 items which have been catalogued in detail. The majority of these are records of photographs. This is an enormous dataset which could generate a large and intricate network graph. However there are many issues to consider and hurdles to overcome before the data is in an appropriate format for network analysis.
Preparing the data
For a network graph to be effective, the data needs to be prepared so that each node represents one unique individual. The information available in the catalogue data to determine who is a unique individual includes the name and address. This should be enough, however the problems come from trying to force irregular historical information into formulaic categories that a computer can understand.
Data problems
Inconsistent names and addresses
The copyright entry forms were completed by hand, usually by the copyright owner, before being submitted to the Stationers’ Company. The writer often filled in multiple forms, sometimes over many years. The way they decided to write a particular name or address on any given day was therefore, as you might expect, inconsistent. Of course, they had no idea that, a century later, a researcher might try to use their entries for computer analysis!
In the data you might find John Robert Smith, J. R. Smith, J Smith and Mr J. Smith living at 12 High Street, Burford, Oxon, 12 High St, Burford, Oxfordshire or simply Burford! While a human observer can easily guess that this is the same person being referred to, a computer cannot. Even a space or a comma in the wrong place can make the data inaccurate. All these inconsistencies need to be corrected before effective analysis can be achieved.
Changes of address
Copyright owners and authors moved between different addresses over time. This makes it more difficult to determine whether a certain name recorded as living at two different addresses if actually the same person. These issues can be corrected with a bit of investigation into the individual concerned, but there are many cases where we simply cannot tell.
Changes in trading names
As well as addresses, changes in names also can cause difficulties in the data. Many individuals are recorded in some places by their own name, and in others as ‘trading as Smith & Sons’. In these cases, it is not that these differences make the data inaccurate or misleading, it is just that they raise the question of how to categorise the data. Should Smith & Sons exist as a separate node or data point, with its specific relationships with other individuals, or should it be amalgamated into one individual. These decisions need to be made on a case by case basis.
Deciding the scope
Following a process of testing the preparation of the whole dataset (130,000) and encountering the various problems mentioned above, I decided that conducting the analysis with a sample set of data would result in a more effective and accurate network graph.
I decided to limit the scope to just one year, 1900, when approximately 3,000 photographs were submitted for copyright.
Final arrangement
To prepare the data, the names and addresses of the individuals were extracted into separate fields. The data was then checked repeatedly to locate inconsistencies and correct them. Where different instances of the same person could be identified, they were consolidated into one individual name and address. Records that referred to multiple different copyright owners and authors were removed, due to the difficulty in incorporating them into the data.
Two separate spreadsheets were then created: one spreadsheet including a list of all unique individuals (the nodes) and their addresses, each with a unique ID number and one spreadsheet indicating the relationships between the unique ID numbers (the edges). The data was then ready to be imported into network analysis software Gephi.
Using Gephi to visualise the network
Gephi is a fantastic free open-source programme which enables you to analyse and visualise network data. Once the COPY 1 catalogue data was uploaded to Gephi project, each individual person appears as one node. The arrows (known as edges) which connect the nodes together indicate those two people had a working relationship, i.e. they appear together on at least one copyright entry form for a photograph.
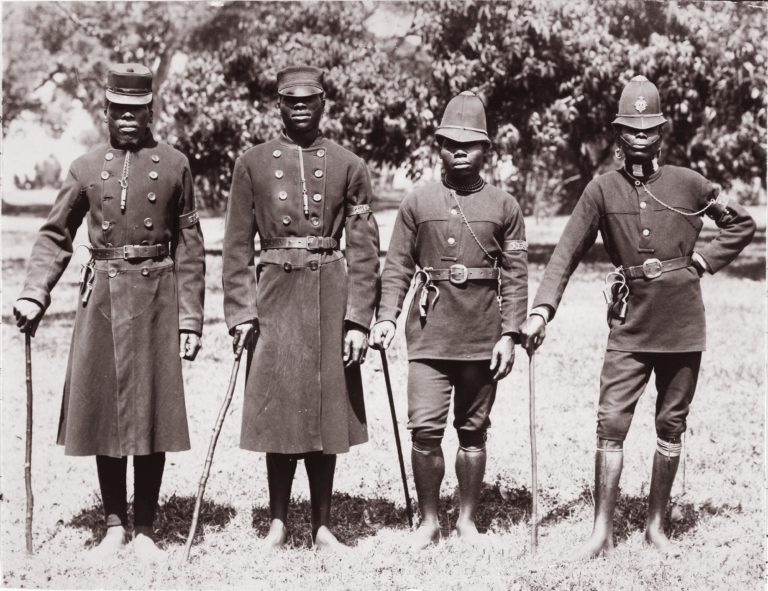
If you are interested in exactly which photographs were registered between the two people, you can simply type the two names into our online catalogue, Discovery, and limit the search to the year 1900 and to the COPY 1 record series. For example, one node labelled William Charles Goodman is connected to one labelled Frederick Parsons. When you search in our catalogue for these names together, you will be presented with record COPY 1/445/203, pictured below.
Nodes
The size of the nodes corresponds to the number of edges it has. So larger nodes are better connected, and perhaps more influential in the network.
The node labels are the names of the people they represent. However, the addresses of the people are still present in the data that informs the graph and help to determine whether two people with the same name are indeed represented by two separate nodes. When you explore the graph using the Gephi software, you are able to view the data underlying it with a single click.
The graph is arranged in a Yifan Hu layout, which brings better-connected nodes to the centre and sends the less-connected nodes out to the perimeter of the graph.
Edges
The thickness of the edges corresponds to the number of entry forms on which the two people appear together. So the thicker the arrow, the more photographs were registered under their names.
The direction of the arrow indicates the difference between copyright owner and copyright author. In this graph, the copyright owner points towards the copyright author (who is usually the photographer). So it may be helpful to think about these arrows as indicating commissions: when a copyright owner points towards a copyright author, the owner commissioned the author to produce a photograph.
Independent photographers
The first thing you might notice about the graph is the large number of nodes around the edge of the graph which are not connected to any other node. The vast majority of the nodes are like this, creating a very sparsely connect graph.
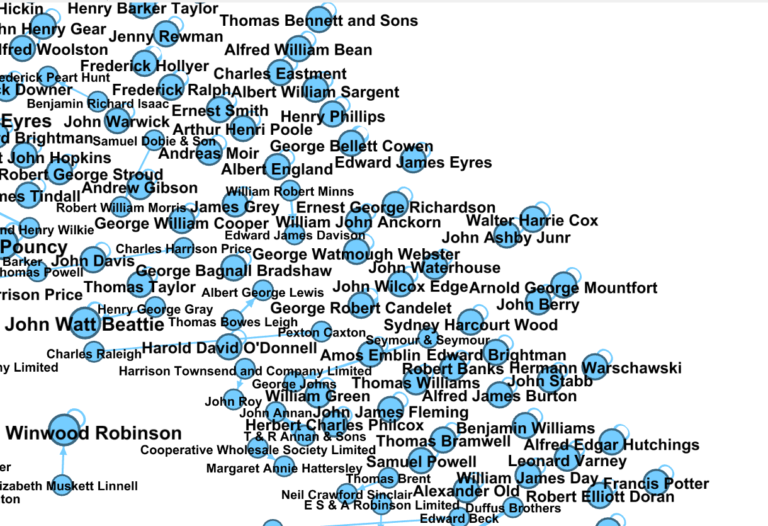
However, if you look more closely, you will see that each of these nodes has a tiny loop coming out of its right side. This is known as a self-loop and is simply an edge connecting the node to itself. This indicates that these individuals were recorded as both the owner and author of copyright on at least one photograph. They are usually photographers who organised their own copyright registration directly, without a middle man, and so owned the copyright protection on their own photographs.
There are nodes which have both self-loops and edges connecting with other nodes. These photographers clearly accepted commissions from others, but also registered some of their own photographs themselves.
Influential copyright owners
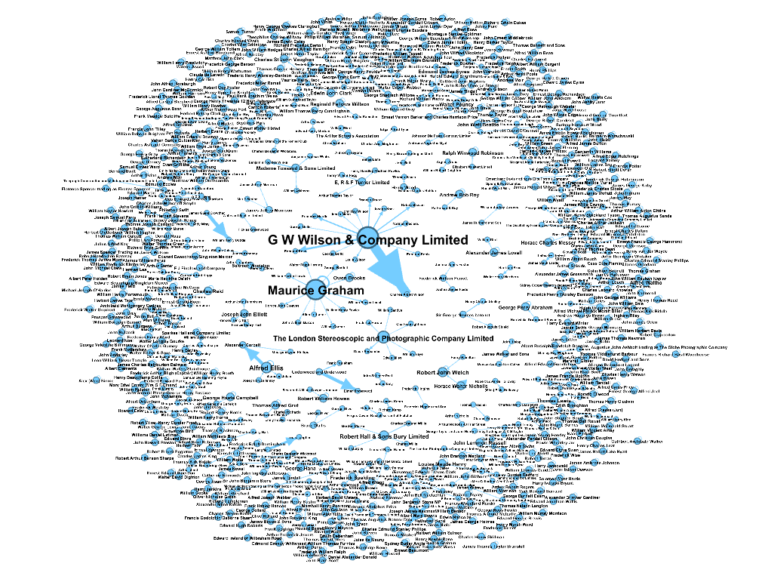
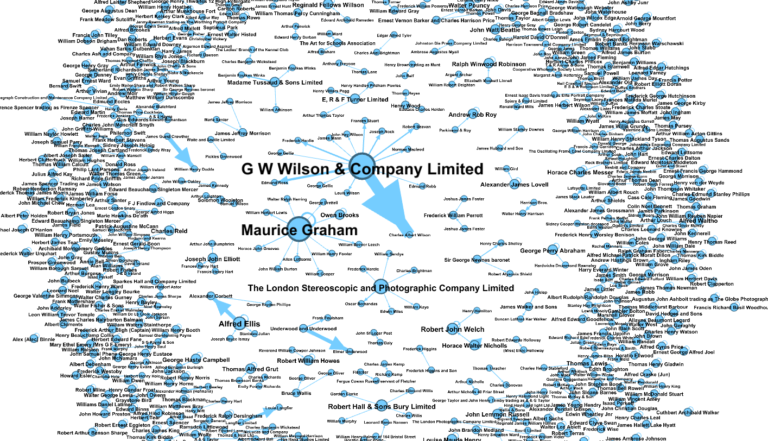
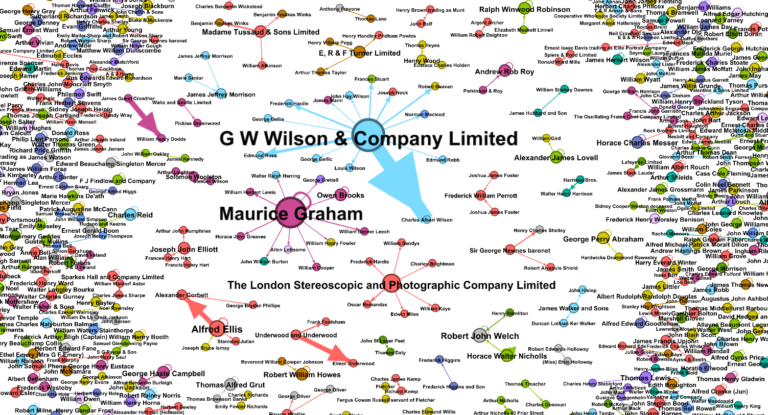
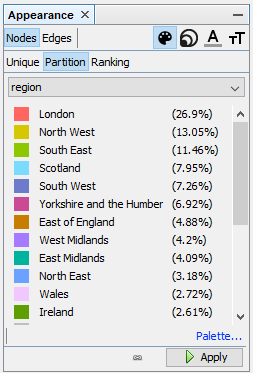
Some nodes are much larger than others. This is because they have more edges connecting them with other nodes. The network graph makes it easy to see who these individuals are at a glance, and which other individuals they worked with. The individuals with the most connections are G W Wilson and Company Ltd, Maurice Graham and The London Stereoscopic and Photographic Company Ltd.
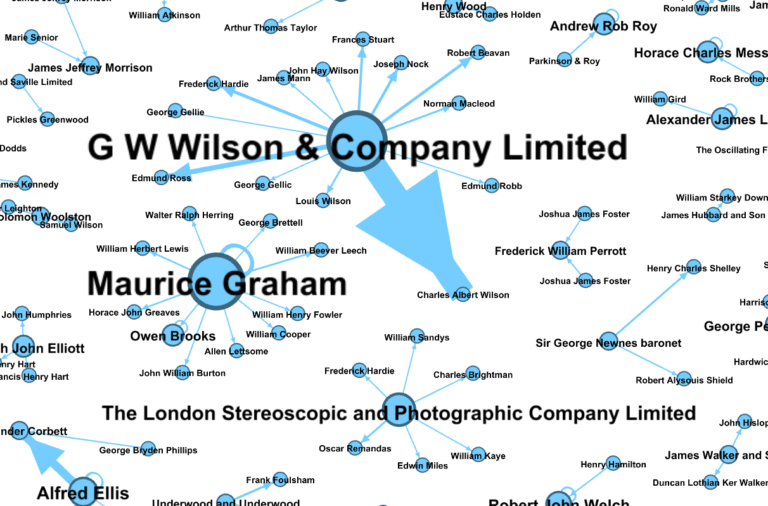
As you can see from the image above, these influential individuals and companies commission multiple photographers to produce work for which they own the copyright. It is interesting also that the photographers who work for these individuals and companies do not have arrangements with anyone else. They consistently work for one company or individual and in most cases do not also register their own work for copyright.
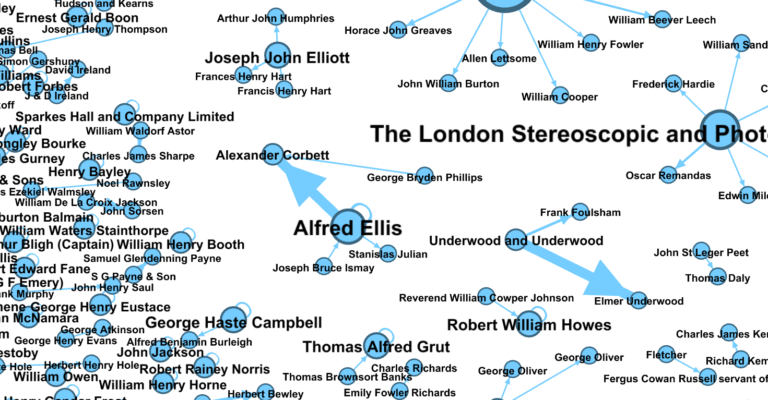
However there are exceptions. In the image above you can see that Alfred Ellis has a more complex network. He registers his own photographs for copyright as well as owning copyright on photographs taken by Stanislas Julian and Alexander Corbett. Copyright on some of Ellis’ photographs are also owned by a Joseph Bruce Ismay. Alexander Corbett in turn has produced photographs which are registered for copyright by both Alfred Ellis and George Bryden Phillips.
Key individuals and companies
G W Wilson and Company Ltd
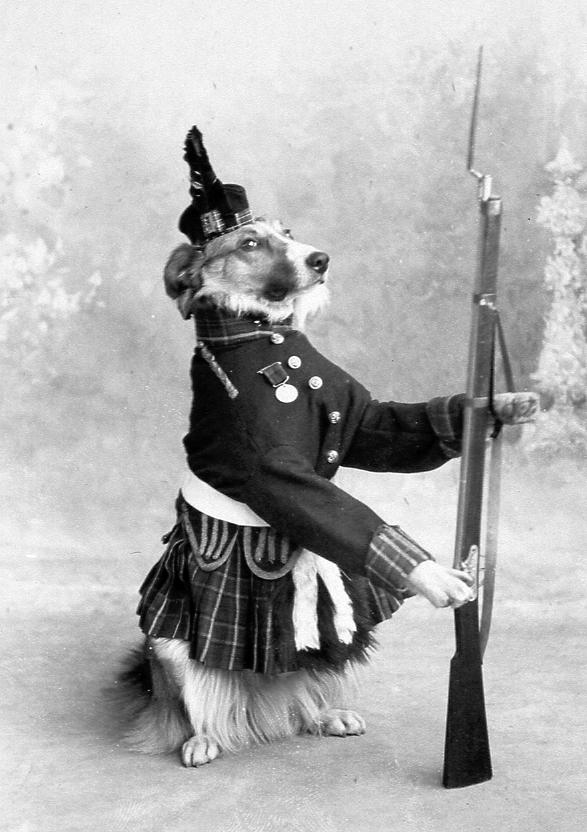
George Washington Wilson was a Scottish photographer, who found success first in portrait photography. He photographed the Royal Family and documented the building of Balmoral Castle in 1854-1855. He then moved into landscape photography. In 1888, his business was taken over by his sons Charles, Louis and John Hay Wilson in 1888[ref]’G W Wilson & Co., Ltd’, The Rhodesian Study Circle, http://www.rhodesianstudycircle.org.uk/g-w-wilson-co-ltd/ [accessed 7 May 2020][/ref], all of whom appear as photographers in the network graph. In 1900 the company was mainly registering photographs of locations and scenes in the United Kingdom and South Africa.
The London Stereoscopic and Photographic Company
The London Stereoscopic and Photographic Company was founded in 1854 by George Swan Nottage, a businessman who served as Lord Mayor of London in 1884. The company was hugely successful, producing thousands of photographs each year, and it specialised in stereoscopic photographs[ref]’London Stereoscopic & Photographic Company’, National Portrait Gallery, https://www.npg.org.uk/collections/search/person/mp16395/london-stereoscopic–photographic-company [accessed 7 May 2020]; ‘George Swan Nottage’, Getty Images, https://www.gettyimages.co.uk/detail/news-photo/british-businessman-george-swan-nottage-circa-1875-he-was-news-photo/101612016 [accessed 7 May 2020][/ref].
Alfred Ellis
Photographer Alfred Ellis was born in London in 1854. He specialised in photographing posed theatrical scenes and live stage performances. He was one of the original members of the Professional Photographers’ Association and a member of the Photographic Society (later the Royal Photographic Society). He was particularly interested in issues of photographers’ copyright. He was one of the founders of the Copyright Union and acted as the plaintiff in two landmark High Court cases in 1894 and 1895[ref]’Alfred Ellis, Photographer’, Historic Camera, http://historiccamera.com/cgi-bin/librarium2/pm.cgi?action=app_display&app=datasheet&app_id=2706 [accessed 7 May 2020]; ‘Alfred Ellis (1854-1930), Photographer’, National Portrait Gallery, https://www.npg.org.uk/collections/search/person/mp67419/alfred-ellis [accessed 7 May 2020][/ref].
Enriching the data
Gephi also gives us the opportunity to visualise any additional information we can add to the data. Based on the addresses of the people in the data, I added details of the region in which they were situated. Based on the first names of the individuals, I also estimated their gender using a tool called Gender API. When this additional information was added into the data, I was able to colour the nodes in the graph accordingly.
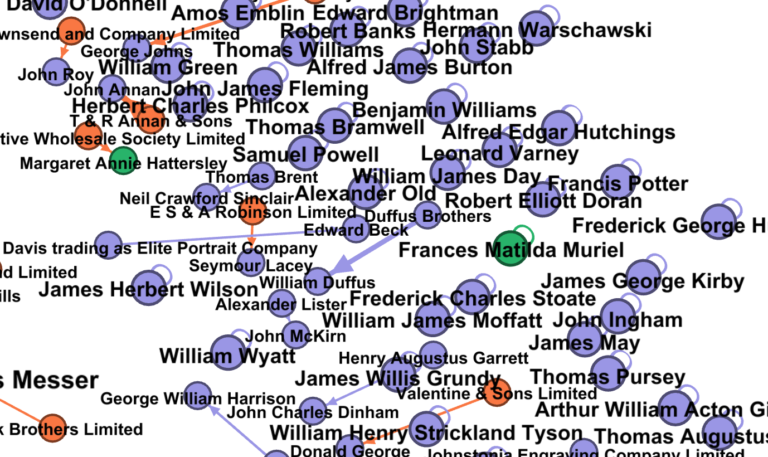
Region
In the image below, each colour represents a different modern region of the UK or foreign country. 26.9% percent of the nodes are in London, but the next most common regions are the North West (13.05%), South East (11.46%) and Scotland (7.95%).
We can determine from this visualisation that most relationships between photographers and copyright owners were fairly local, particularly for simple arrangements between two people. However some of the more influential copyright owners worked with a range of photographers from further afield, particularly G W Wilson and Company and Maurice Graham.
Gender
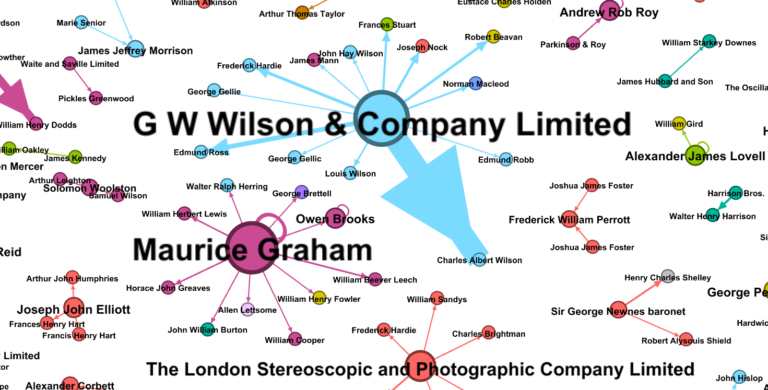
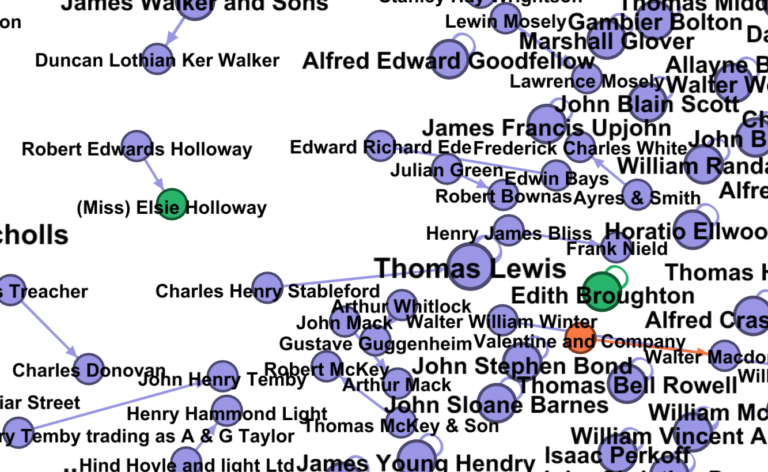
Colouring the graph by gender enables quick analysis of how women were involved in the photography industry in 1900. In the images below, individual categorised as male are coloured in purple, female in green and companies in orange. Approximately 3.4% of the nodes are female.
It is interesting to see how the women appearing in the graph interact with the other individuals. Many of them are independent, registering their own photographs for copyright, such as Frances Matilda Muriel and Edith Broughton. Others share edges with other nodes, however there are no instances of two women being connected together.
Key women photographers
Elsie Holloway
For women with links to other nodes, familial relationship can be seen. For example, Elsie Holloway was the daughter of landscape photographer Robert Edward Holloway and set up a portrait studio with her brother Bert in Newfoundland, Canada, after her father’s death. From this graph we can see that, in 1900, her father registered one of her photographs for copyright in the UK. Elsie Holloway was celebrated for her portraits of children and for her photographs of the Newfoundland landscape[ref]’HOLLOWAY, Elsie’, Canadian Women Artists History Initiative, http://cwahi.concordia.ca/sources/artists/displayArtist.php?ID_artist=5631 [accessed 7 May 2020]; ‘Elsie Holloway (1882-1971)’, Heritage Newfoundland and Labrador, https://www.heritage.nf.ca/articles/arts/elsie-holloway.php [accessed 7 May 2020][/ref].
Frances Matilda Muriel
Frances Matilda Muriel spent time in India and Burma (now Myanmar) where her husband Ernest Muriel worked in the Forest Service. She photographed the landscape and people and won prizes for her photographs at exhibitions in India. She was also a painter and hand-tinted some of her own photographs[ref]’Frances Matilda Muriel’, Luminous Lint, http://www.luminous-lint.com/app/photographer/Frances_Matilda__Muriel/ABCDEF/ [accessed 7 May 2020][/ref].
Further research
This analysis and visualisation of photograph entry forms from 1900 gives just a snapshot of how useful this kind of analysis could be for collections at The National Archives. There are hundreds of thousands of records which could be incorporated into future network analysis research, including the rest of the COPY 1 series but also potentially other kinds of records. The main obstacle to research with larger datasets is simply the difficulties in preparing and correcting the data to make it suitable for computer analysis.
The ability to view connections between records and individuals at a glance is highly valuable as it can make the catalogue data far more comprehensible. One can spot interesting and unexpected connections, notice which individuals are most influential and, with the addition of demographic information, understand the shape and nature of professional and social networks of the past. I will continue to pursue this kind of research with more records at The National Archives.
This is a fantastic peice of work and a great way of viewing records through a different lense. Thanks for this insight into how TNA is working with its data in a more imaginative way!