On 20 and 21 June 2019 a workshop was held at The National Archives titled ‘Exploring Data, Investigating Methodologies’, which was organised as part of the Computational Archival Science programme. The goal was to explore archival data here at The National Archives with the help of computational methods.
The participants were split into several groups and we were part of the Web Archiving group, which explored data from the UK Government Web Archive (UKGWA) using network graphs.
With over 22 years of content now in the UKGWA, the value of the archive as a dataset is greater than ever before. We are keen to encourage research into it as we believe it can address many interesting questions about the evolution of UK government online. We hope that, by using techniques like those in this blog post, others can pose their own questions and devise ways of answering them through the data.
The initial, basic question we wanted to explore was ‘How is the government web linked together at different points in time, and how might this have changed over the last 10 years?’
The data and the tool we used
The dataset that we worked on was created by our colleague Mark Bell, who crawled through, or extracted, the first page of every entry in the UKGWA ‘A to Z’ list of archived websites. For each of these sites, about 4,000 in total, Mark extracted links at three points in time – on, or as close as possible to, 1 January 2009, 1 January 2014 and 1 January 2019. Every link on the web page was harvested, which we refer to as ‘level 1’ links, resulting in a dataset with more than 4,000 domains and their target links. These target links could be internal, referring to a part within the website, or external, referring to a website outside of the main website.
A further data generation step was taken, in which the links extracted for ‘level 1’ were followed, and these formed a dataset we called ‘level 2’ links. You can see the data for yourself at the end of this blog post.
To visualise this data we focused on using a tool called Gephi, an open-source tool through which you can explore and visualise graphs and networks. You do not need to be able to program to use this tool and we found that it is easy to use, even for people who have no experience in network graphs. Within minutes we were able to generate graphs, which was very exciting. Without using this approach, we would have had to add in these links manually, which would have taken weeks, months or even years!
A quick note on terminology: a ‘node’ in this case represents a domain (e.g. www.direct.gov.uk) and an ‘edge’ is a link between one node and another.
The team was split into several smaller groups with people taking slightly different approaches and using different techniques. Some worked on link structures, some on rankings, while we focused on community detection, also known as modularity.
What we found
We have summarised a couple of the experiments we conducted, along with some (tentative!) interpretations:
Level 1 link structure
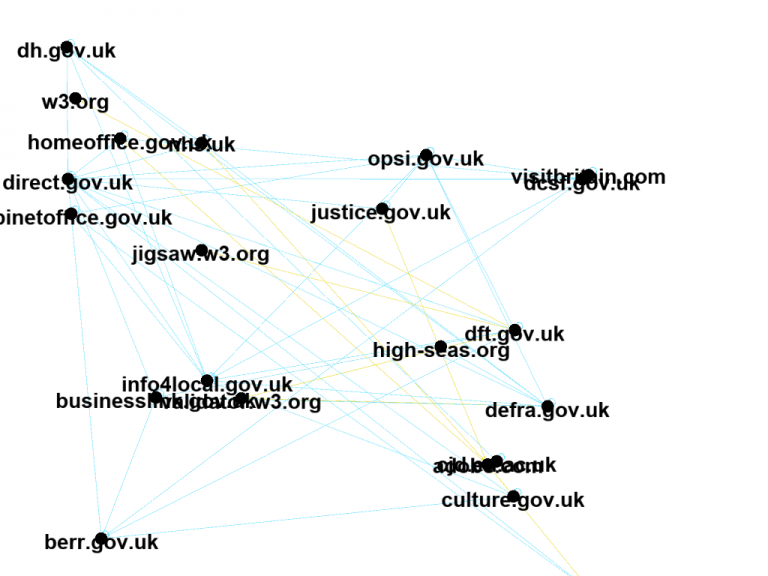
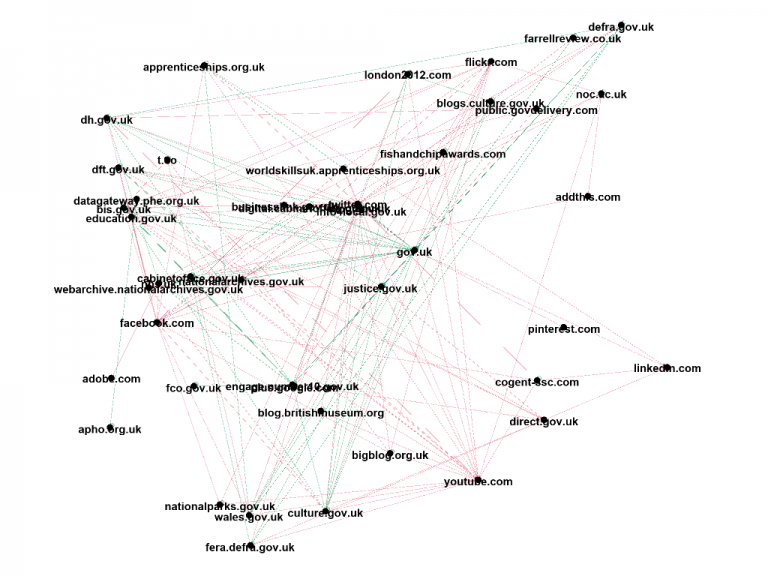
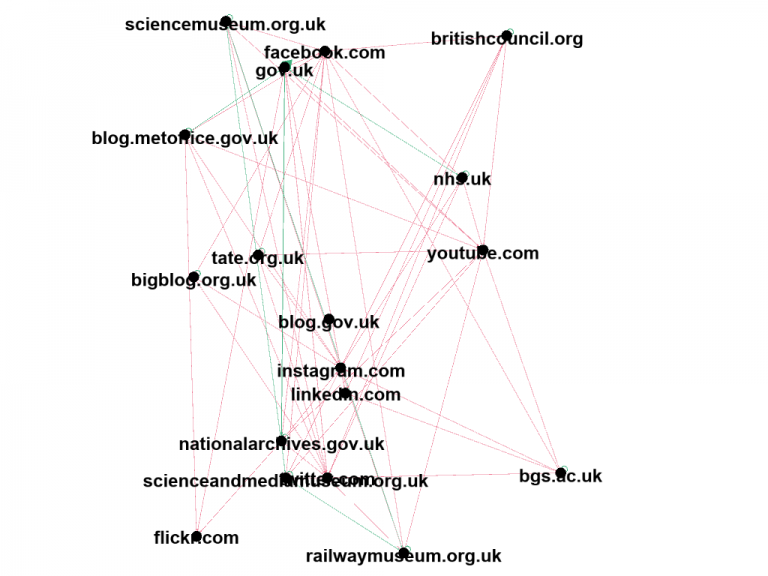
One of our team members, Alex, created a set of visualisation that can be seen below, and she provided the following description:
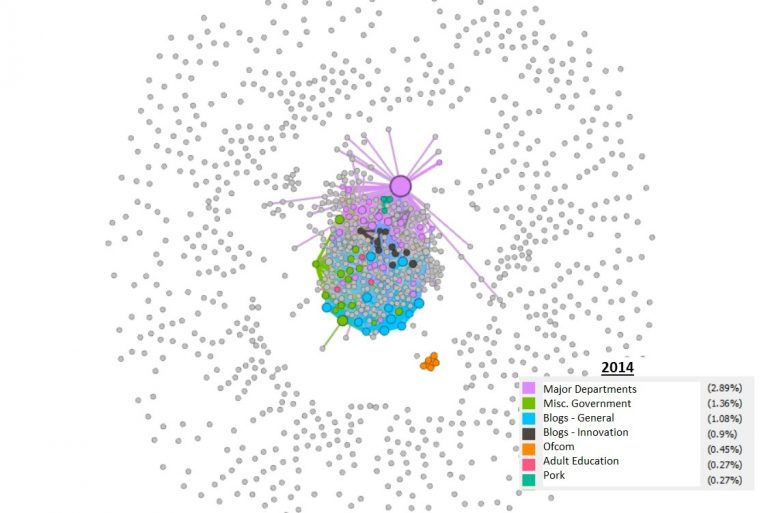
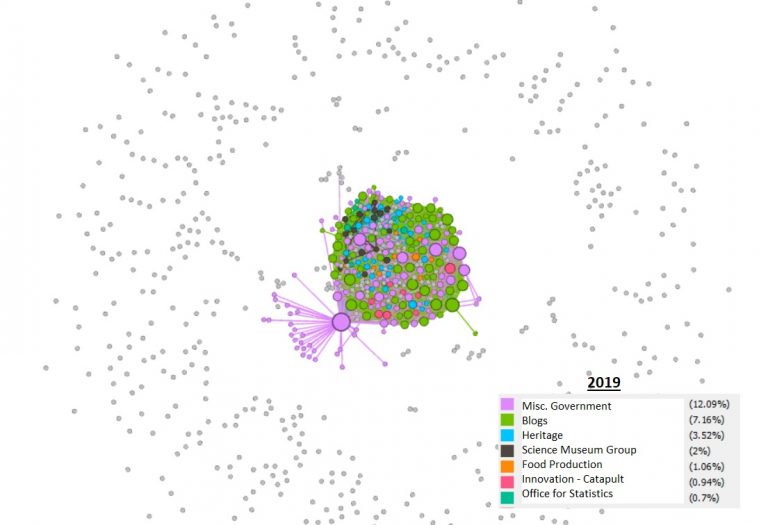
The following visualisations show the changing structure of level 1 links from the UKGWA using snapshots from 2009, 2014, and 2019. Striking results include the change in the number of nodes and the comparison of government to non-governmental websites. We can see the explosion in sites from 2009 to 2014, but then a surprising reduction in nodes between 2014 to 2019.
In comparing government to non-government results, we can see in 2009 the balance is almost half and half. Conversely, in both 2014 and 2019 this has shifted to a roughly 60/40 split in favour of non-governmental websites. Given the proliferation of social media among this, it seems likely that this is due to the increase in government social media profiles and the promotion of their ‘follow’ links.
Level 1 Community Detection, or Link Modularity
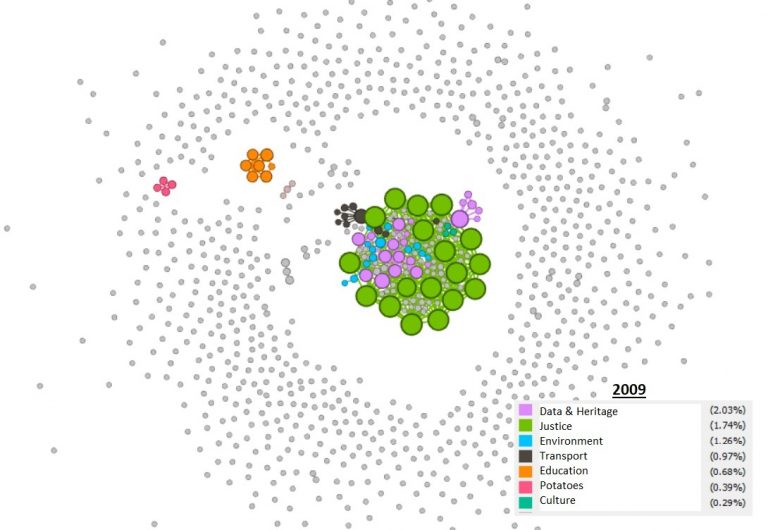
In Gephi, modularity is a score which attempts to group nodes together to illustrate ‘clusters’ of nodes that have certain things in common, indicated by their linkages. The following visualisations were created in Gephi but required interpretation by a person with some domain knowledge. We manually applied this knowledge to the ‘clusters’ to label them. This had mixed results and drawing any firm conclusions would be required during future research.
In the first image, the orange ‘education’ cluster is densely connected within itself but isolated from the main cluster. The 2019 image shows much more connectivity, or edges, between clusters, which could indicate that sites are more interconnected and that there are fewer isolated nodes. The interesting consistency across the three are the grey nodes, ‘orbiting’ away from the centre, which represent more isolated, unlinked websites. As a rule, these have been decreasing over the years.
Conversely, blog usage has increased in this time and these have formed their own clusters, though closely linked to other node groupings.
Our Experience
Creating these graphs was easy, with the help of Giovanni from the Alan Turing Institute and, along with information from tutorials online, we had created meaningful graphs in no time. A tool like Gephi is a necessity to work with this type of data, as for our last graph we had more than 100,000 links between the websites. Again, an important finding is that, when it came to the interpretation part of the exercise, it was necessary to have an understanding of the web archive.
Two things that we can take away from this workshop are that trying out new tools may not be as daunting as it first seems. And also, that data preparation is really important: Mark and Giovanni spend a lot of time making the data usable for us so we could spend as much of our time as possible actually experimenting with it.
Another form of preparation was conceptual, meaning that in order to construct questions, a certain starting understanding of what the web archive is, and what it contains, was important. A future challenge for this data is how to unlock the domain knowledge relating to the history of the government web estate and encapsulate it in an accessible form, which will help with interpretation of the data from those without this explicit knowledge.
Overall, we were pleased with what were able to achieve during the workshop. We will only be able to draw firm conclusions through much more detailed analysis than we could perform in the time we had but this was a good start in using the rich UKGWA collection for this kind of research. We hope that it inspires more investigations like this.
Give it a go!
You can download the actual source data (zip file, 150MB) we used.
This is a really good tutorial for anyone who wants to get started with Gephi.
A technical note about the data: when the file is unzipped, within the directory ‘ToS3’, are 160 text files. Here is an explanation of these:
- Level 1 links. These are the l1_pages* files are lists of links from the home page of each site that was archived at some time one year either side of the year in the file (2009, 2014, 2019). The 0-19 suffixes are there because we split the load into 20 partitions, allowing multiple crawls in parallel, for ease of generation.
- Level 2 links. These are the l2_pages* files are the links found by following the links in the l1 files.
- The summary files just count the number of links found on any particular page on Level 2.
If you wish, you can also download some of the image files (zip file, 1MB) above in higher resolution.
Thanks to all the organisers and participants in this event and to everyone who took part in our team.
Web Archiving Team Leaders:
- Dr Giovanni Colavizza, Senior Research Data Scientist, The Alan Turing Institute
- Mark Bell, Big Data Researcher, The National Archives, UK
Participants:
- Tom Storrar, Head of Web Archiving, The National Archives, UK
- Leontien Talboom, PhD student, UCL/The National Archives, UK
- Dr Rafael Henkin, Research Associate in Visual Data Science, City University
- Alex Leigh, PhD student, City University/The National Archives, UK
- Dr Rossitza Atanassova, Digital Curator, The British Library
