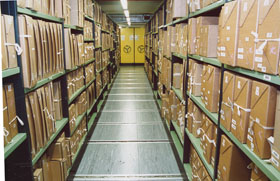
Collection Care is often about finding solutions to difficult problems and I addressed this theme in my last post when I talked about a project currently underway treating a particular series of photographs. Well, this problem-solving approach applies not only to our conservation treatments of the collection, but also to how we deal with things on a large scale – how we manage our collection.

What is in all the boxes?
One of the big questions we’ve grappled with as part of this project has been: what do we have? Oh, we know we have 11 million entries on Discovery, 13,000 series of records, etc. But to effectively manage the risks to our physical collection we need to know what types of materials we’re dealing with and how many of each we have. Tackling this question required extensive data gathering and some visual ingenuity.
We selected seven categories of materials from the collection we were interested in: paper, parchment, photographs, works of art, artefacts, plastic (such as microfilm and photographic negatives) and textiles. While the information we were looking for was simple enough, gathering it proved a challenge given the scale (over 180km of physical records) and that there was no workable single source of the data.
Discovery has a physical description field, but the terms used are often inconsistent and describe the format of records rather than the material. Undaunted, we persevered with this as our main source. When the description field entry was inconclusive we relied on the date of a record as an indication of material, for example parchment was used for writing on during the medieval period. This resulted in us being able to categorise most of the collection.
Of those records that still remained uncategorised, many material types were identified through the help of colleagues across The National Archives. That left only several hundred where someone had to go and open a box to actually check what type of material was inside.
The results showed our physical collection was predominantly paper (81%). Parchment makes up 16% and photographs and plastic 1% each. All the remaining categories along with a few still undefined items make up the remaining 1%.
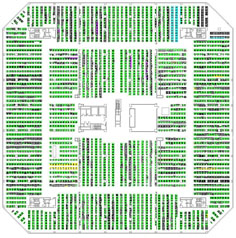
While this answered our initial question, we were interested in further interrogating the data we had worked so hard to collect. At this time we were working on mapping our environmental monitoring data, and the ability to visually locate where the different types of materials were stored in our different repositories would provide a good cross-over between both projects.
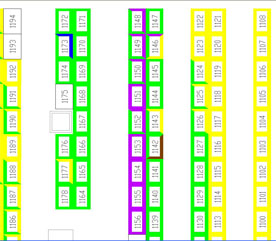
Working with experts in facilities management mapping software, we have developed colour-coded maps of our repositories that show the materials located in each bay. The ability to map data across our repositories has proven useful in responding to other collections management questions we’re interested in as well. One of our most recent examples is a project to devise a cleaning regime for the repositories. By mapping which bays hold the documents that are ordered most frequently we can concentrate our cleaning efforts on those areas that need it most.
We’re really excited about this visual tool we’re developing. We still have a lot of work to do as 1 km of new records arrive at The National Archives each year, requiring regular updates to keep the maps current, but we’ll keep striving to use these opportunities to learn more about our collection and the diverse materials we hold.


Hi Carla,
Thanks so much for your kind words. I’m pleased to hear that you are enjoying the blog.
If you are looking specifically for more blogs on conservation and preservation subjects you could try the British Library Collection Care blog http://britishlibrary.typepad.co.uk/collectioncare/
You could also check out online an organisation that promotes conservation such as the IIC (International Institute for Conservation of Historic and Artistic Works) or ICON (Institute of Conservation) or another national organisation depending where you are in the world as they often post links to blogs and stories on Facebook or Twitter.