Last November, I wrote a blog post about digital storytelling, outreach and archives, in which I talked about how digitisation has created new and innovative opportunities to connect with audiences using archival material. I touched then upon digital storytelling specifically using social media. Over the past few months, however, I have experimented with another medium, and focused on how else we might be able to compile digital stories and present archival material in engaging ways.
What’s the story?
Using Esri Story Maps*, I have created a digital story about Peterloo. Esri Story Maps is primarily a web mapping application that also lends itself very well to presenting narratives. 2019 is the bicentenary of Peterloo so it seemed appropriate to focus on this event for a number of key reasons.
It was an opportunity to create a digital story that could have value beyond experimentation, contributing to this year’s planned commemoration events and shining a light on Peterloo’s (somewhat unheralded) significance in the history of British democracy. And by focusing on presenting the story in a different, digital way, it was a chance to reach new audiences who previously might not have engaged with the narrative.

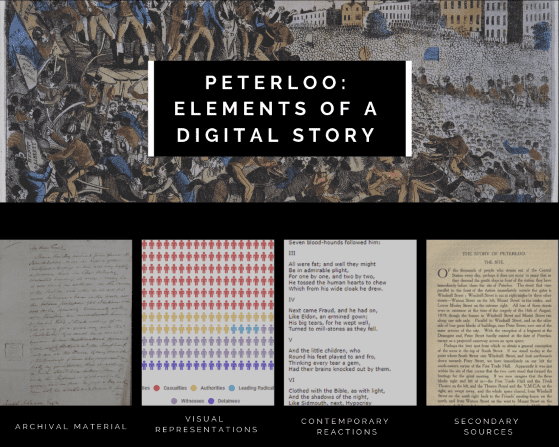
Elements I included to create the digital story
How did I do it?
I thought it would be useful to set out how I compiled the Peterloo digital story. There are many ways to tell a story, and this isn’t necessarily the right way – it’s just one way. But that’s the beauty of storytelling – possibilities abound.
Step One: Research
I began by researching not only the topic of the story, but also the tool I wanted to use for the project. Having previously undertaken some market research on digital storytelling tools, I settled fairly quickly on what I wanted to experiment with.
I chose the Esri Story Maps application, specifically its ‘Cascade’ option. Its website describes a ‘template that lets you combine narrative text with maps, images, and multimedia content in an engaging, full-screen scrolling experience’. Having looked at various sites that use scrolling as the means of taking the user through the story, I felt it created a more seamless, connective experience than something that requires continual clicking through different screens. I found the Hackastory tools directory very helpful whilst considering what options I had for creating the story.
Not having a specific topic in mind, I settled on Peterloo after exploring key historical anniversaries taking place in 2019, and set about researching in Discovery. The great thing about Discovery is that it not only holds The National Archive’s catalogue records, but also record descriptions from other UK archives. Scrolling through the search results and seeing many other archives with Peterloo material, I realised that this had potential to become a bigger story than just about the Peterloo material held at The National Archives, and one that could be told from different viewpoints.
Step Two: Evaluation
At the outset I examined and evaluated all the material I had to work with, looking at it through the lens of the storytelling arc. As well as the primary sources I would be including, I looked at contextual material also. You may not always have enough archival material to tell a complete story so secondary sources can help to provide context and key points, particularly if you are covering a historical event.
I ended up with four main elements I wanted to combine to create the digital story:
- Archival material: This was key and the whole reason I was creating the story!
- Visual representations: Creating infographics that represent parts of the story can be powerful. Historical events lend themselves to visual representations in terms of time, geography and people. For Peterloo, I included a visual representation of the people involved and how they were affected, and a timeline of the day itself, with timings of how events unfolded.
- Contemporary reactions: These can provide another angle to the story and I was able to include a poem written and published at the time which was a response to Peterloo.
- Secondary sources: These are also key for scene-setting and providing context to the primary sources. I was able to frame the story the primary sources told around the facts of the event.
Step Three: Compilation
After evaluating everything I was able to group the material together in batches that told different parts of the narrative. I ended up with five distinct story segments.
- Scene-setting: Contextual information that allows the reader to understand Peterloo in the context of the time.
- The day itself: Key timings as the event unfolded.
- The immediate aftermath.
- The victims.
- The aftermath: What happened in the weeks and months after the event?
I created a storyboard using MS Word to sketch out the main parts to the story and what material would be featuring in each section – archival material, visual representations or secondary, contextual information.
I ended up writing the key bits of text for the story in MS Word too, as this not only helped keep things organised, but also serves as a useful backup copy of the story if I want to replicate it in another tool.
Step Four: Creation and editorial
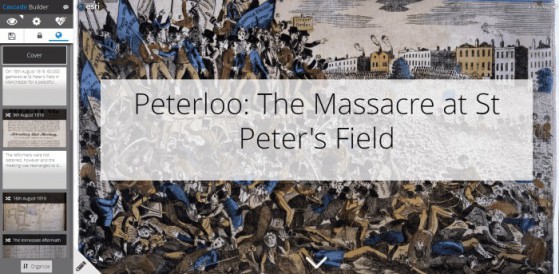
Having compiled the text, infographics and images, I loaded the content into the tool. I found the Story Maps Cascade interface very intuitive and user-friendly. Piecing the story together felt effortless, with a simple workflow to follow, and the tool builder made it easy to see the story come together as a whole.
Having created the story I was able to view it as if I were a user, which was incredibly helpful as I could see if the narrative flowed and connected well.
Audience and outreach
When I was setting out to develop the story, I didn’t have a specific reader in mind. I wasn’t creating it for a particular audience and so didn’t tailor it to one specific group. By omission this meant that some groups – for example schoolchildren, or academic researchers – might not get what they need from the story and therefore might not necessarily engage with it.
A gallery of digitised images can be incredibly useful to a researcher, who is able to interrogate the material whilst being in a different geographical location to the physical items. A digital story, on the other hand, may not give them what they need.
However, engagement through a public history lens may be more appropriate for a digital story such as this one. Surfacing stories and presenting them in different ways, I believe, can be a great way to reach audiences who may not have engaged previously with such material, or who may think that archives are not for them. In order to reach new and diverse audiences, we have to experiment with new and diverse ways of presenting archive material.

The interface of the tool used during the creation of the digital story
The Peterloo digital story
You can view the Peterloo digital story, Peterloo: The Massacre at St Peter’s Field on the Esri Story Maps website. This story would not have been possible without the contribution of digital images from ten UK archives. I’d like to thank those archives for their time and assistance and, of course, their digital images of the archive material that enabled me to represent the story of Peterloo.
- Manchester University: University of Manchester Library
- Cheshire Archives and Local Studies
- Working Class Movement Library
- Cumbria Archive Service
- Manchester Archives and Local Studies
- Norfolk Archives
- Sheffield City Archives
- Bolton Libraries and Local Studies Service
- Devon Archives and Local Studies Service (South West Heritage Trust)
- The Record Office for Leicestershire, Leicester and Rutland
*I used a free tool to create the digital story as well as free graphic design sites Piktochart, Canva and Vennage to create the infographics in the story. The availability of open source and free tools is a real boon for digital engagement. However, it is, of course, not without its risks – in May 2018 Storify, a popular digital storytelling platform, closed down. Even the recent news story of MySpace losing 12 years’ worth of music uploads shows the fragility of digital. While it is important to acknowledge these risks and plan our digital engagement accordingly, the opportunities for engagement and reach can outweigh the risks in many cases.