I am a PhD student in the department of Classics at King’s College London. I have worked previously in museums and heritage education, and my PhD project has involved working with online databases, GIS mapping software, and data manipulation. My eight-week placement at The National Archives, working with the Research and Academic Engagement team, was themed around digital scholarship in archives. It involved both discussions with National Archives staff about their work with digital materials, and the employment of methods and practical tasks.
One of my practical tasks was a data case study with Friends of the National Archives Research Fellow, Andrea Kocsis. Andrea has been working on the data collected from the crowdsourcing project Operation War Diary (OWD). My task was to evaluate the usefulness of the Google Sheets Wikidata plug-in for geo-locating place names. Wikidata is a free and open knowledge base made up of structured data, in which every item on Wikidata has a label and a unique identifier (QID), for example London Q84. The plug-in for Google Sheets allows the spreadsheet to interact directly with Wikidata and pull data from the site into the spreadsheet.
We followed the method used by Emma Carroll (Witchfinder General) to locate place names in the Scottish Witchcraft Database, using the plug-in to search Wikidata for the place name and retrieve its unique identifier and geographical coordinates. The scale of the projects is somewhat different (the Scottish Witchcraft Database contained less than 1,000 place names while OWD contains over 1,900,000) and so Andrea and I were investigating whether the methodology would work at scale. Because the OWD data set is so big, I worked with a small section of 30,000 place names to test the methodology.
Matching place names
I began by using the formula =WIKIDATAQID to retrieve the QID for each place name on my list. This was a slow process, as copying the formula for more than 1,000 cells at a time caused the page to freeze. It also took time for the information from Wikidata to load, and to prevent this being a problem every time I opened the sheet I copied the column and pasted values only.
Out of my list of 30,000 place names this process retrieved 5,357 QIDs – a dishearteningly small number. However, I then began to investigate the places that had not been matched. I sorted the place names in alphabetical order to make misspellings more apparent and worked down the list manually categorising names as misspellings or unmatched places. I discovered that almost half of the first 10,000 place names in my list were misspelt, and although I as a human could see what the name was meant to be, Wikidata could not (although interestingly the misspelling ‘Belguim’ was correctly identified as ‘Belgium’).
Only about a third of place names were spelt correctly but unmatched, and I copied these into a separate sheet to sort them into more specific groups and investigate why they had not been identified.
- 29% of the unmatched place names were the names of trenches, headquarters, camps and depots. These were important to the military but are unlikely to survive on modern civilian maps or have entries in Wikidata.
- 18% of the places were too general, not the names of a single place but describing a road, waterway or region. Often these have been recorded as a list of two or more place names, which may or may not be separated by punctuation, making it difficult to find automated ways to separate lists of place names from place names consisting of several words.
- 4 instances were of a ship’s name or simply ‘At sea’.
- 13% of place names were not recognised because they refer to a very specific place within a settlement, either an address or a very specific building such as a station, cinema or school. Another 4% of place names were descriptions of a place in relation to a named location e.g. 1 mile from, near, north of.
- 11% of places names were duplicates not recognised due to incorrect punctuation (e.g. Achiet-le-Grand is matched but Achiet le Grand is not) or the addition of details (e.g. Bellevue is matched but Bellevue, Ghent, Belgium is not).
This left around a quarter of unmatched place names which were spelt correctly and could reasonably be located on modern maps but were not identified by Wikidata. As in the case of the Witchfinder project, this probably indicates that these places have not yet been added to Wikidata. Although it initially looked like Wikidata/Google Sheets had not identified many places, there were actually only 744 it is reasonable to consider missed.
Geolocation
I then moved on to working with the place names which could be identified by Wikidata. I copied the place names and QIDs into a separate sheet. I then used =WIKIDATAFACTS to check the identifications, revealing that only about 3,090 had been identified as places. 1,413 QIDs were for disambiguation pages, mostly indicating that there were multiple places with the same name. There was a particular problem with settlements named for saints, as while some larger and better known places were identified as such, several others were identified as human or led to disambiguation pages for human/place name. I used =WIKIGEOCOORDINATES to retrieve the geographic coordinates Wikidata has stored for each place name, which successfully retrieved 2,240 places coordinates.
I then used Open Refine to import the Q numbers and geo-coordinates I had found into the original spreadsheet and joined the new coordinates with the existing latitude and longitude columns. With this more complete data set, I was able to experiment with creating visualisations of the data I had been working with.
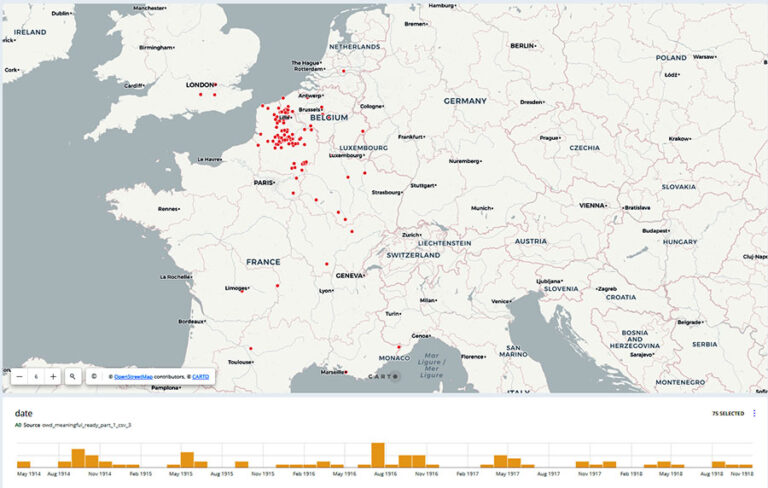
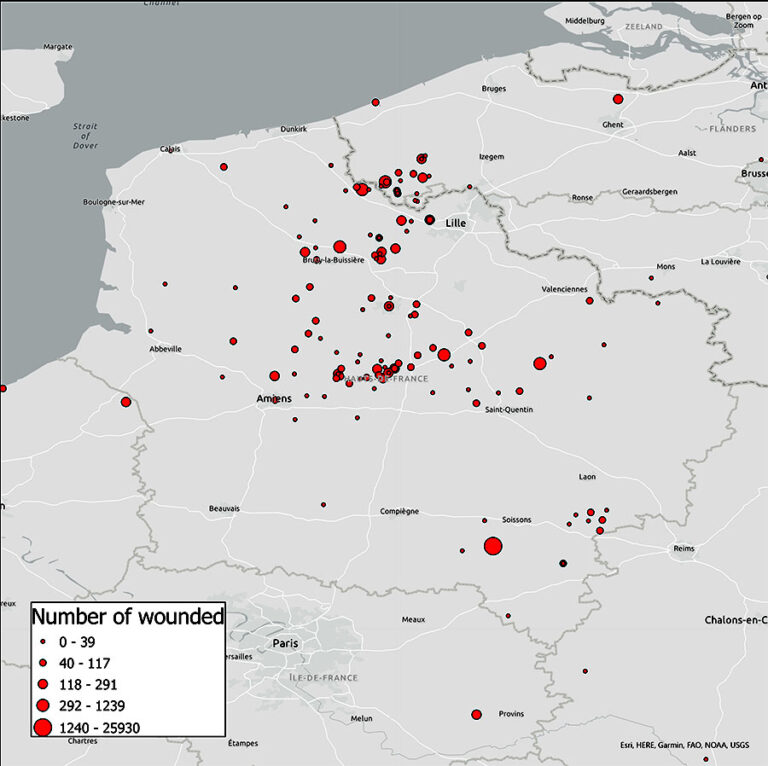
Visualisations
I used Carto, a browser-based spatial analysis platform, and ArcGIS Pro, a desktop program which I have been using for my PhD project. Both platforms allow different ways of working with data. Carto’s free online platform offers simple controls which make it quick and easy to create an effective visualisation. ArcGIS Pro is more involved but also offers more possibilities for what you can do. I focused on creating visualisations around the numbers of wounded recorded in diary entries, experimenting with showing this through symbology or in pop-up information boxes.
Reflections
This data case study was a great opportunity to experiment with new tools and to work with a much larger data set than I am used to. My PhD data set currently consists of around 600 objects, so working with a data set of almost 2 million entries was a big change. It was also interesting to see the kind of messy data generated by crowdsourced projects and the considerations that need to be made before, during, and after the project to get maximum use from the data gathered. Mostly though, it was just fun to work with a big chunk of data, knowing that my exploration and experimentation was supporting ongoing research at The National Archives.