In my last blog I highlighted the opportunities of using cataloguing as an historical dataset, and explained the basics of how to extract the information and turn it into a usable form. Today I am going to go a little bit further and discuss some of the things you can do with data extracted from our catalogue, using the series HCA 32 as an example.
This series contains records relating to ships captured as prize. This often includes the ship’s papers, and letters and other material on board the ship at the time of capture. Colleagues of mine have been running a major project to sort and catalogue this extraordinary collection in order to make it more accessible to researchers. I am going to be drawing on some of this work for ships captured during the Second Anglo-Dutch War, between 1665 and 1667.
I started in the same way as I described in my previous blog, by downloading the relevant catalogue descriptions from Discovery. The information contained in the descriptions is very rich, but is neither as uniform, nor as structured as that in SC 8, the record series I discussed previously. An example of the type of information provided in the catalogue can be seen below.
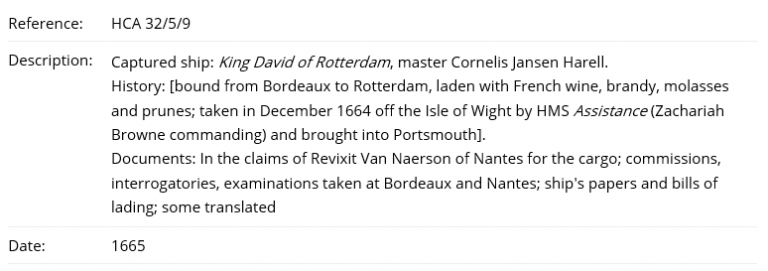
Catalogue description for HCA 32
As the relevant data was less structured I used the programme OpenRefine to split out what I wanted and clean it up to create a usable resource. This is relatively simple to use and there are some excellent tutorials online explaining its functionality.
After a little bit of work I had a dataset with fields providing a range of information including the name of the ship, its home port, its port of origin, its destination and details relating to its capture.
This dataset contained nearly 1000 entries, but closer examination revealed that some of these were duplicates. This is where it is important to keep in mind exactly what it is you are dealing with.
These are catalogue entries for documents, or bundles of documents, and on occasion there are multiple documents for a single capture. Thus I had to go through and remove any duplicates. I did this by filtering the data, and using Excel to highlight multiple entries with the same name of ship and master.
At the same time I kept my eye out as I knew some ships were in fact captured on more than one occasion during the same war. In fact the data reveals that two ships, both named St Peter, had the unfortunate distinction of being captured on three separate occasions!
With this complete I now had a data set of roughly 900 individual captures. We do not have full information for all of these ships, but there is a huge amount of data which represents an extraordinary resource for understanding English commerce warfare in the Second Anglo-Dutch War.
Surprisingly, there has been very little written about the English campaign against Dutch trade in the Second Anglo-Dutch War, and so the data reveals considerable new insights about the dynamics of the capturing forces. The graphics below clearly demonstrates that it was naval vessels as opposed to privateers which were the most effective commerce raiders taking over two thirds of the prizes.
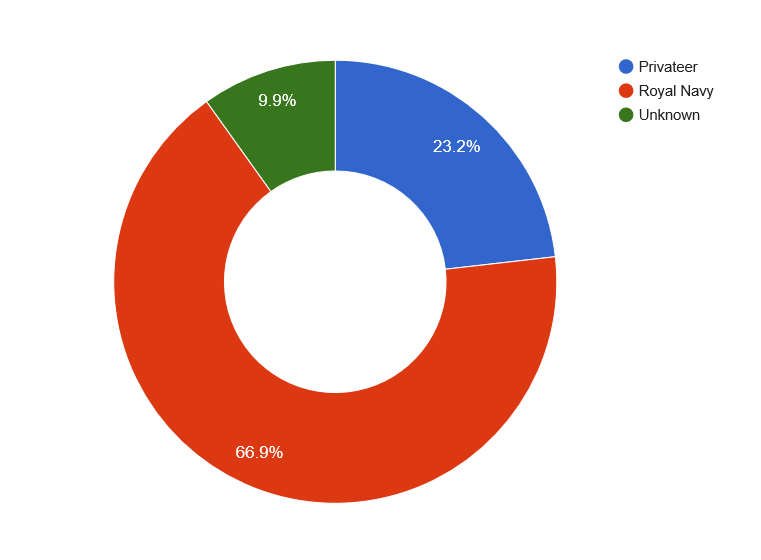
Breakdown of captures recorded in HCA 32 by type of capturing vessel (Graphic produced in Google Fusion tables – linked to online version)
We can then break this down to look at the most successful ships and commanders. By combining this information with some further research into the archival collections we could quickly build up a complete new understanding of how the English war against Dutch trade was prosecuted.
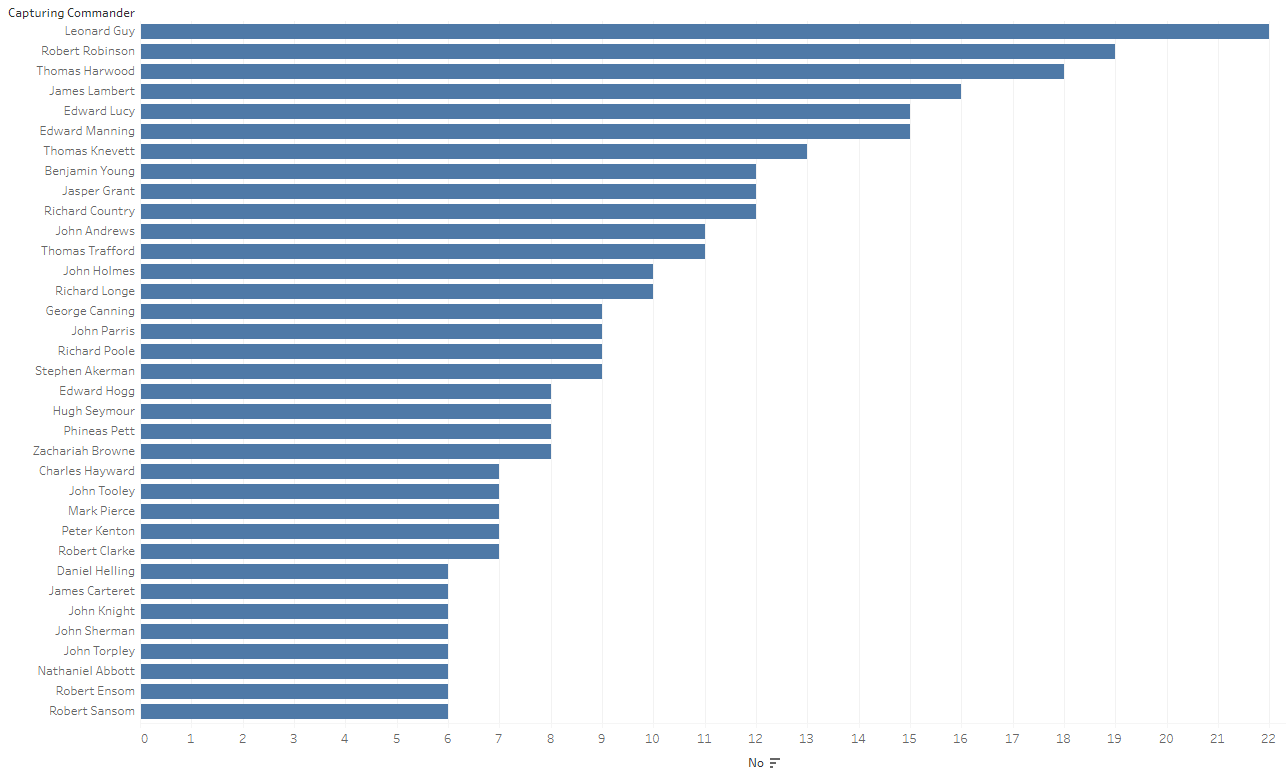
Chart showing the most successful capturing commanders (Graphic produced in Tableau Public – linked to online version)
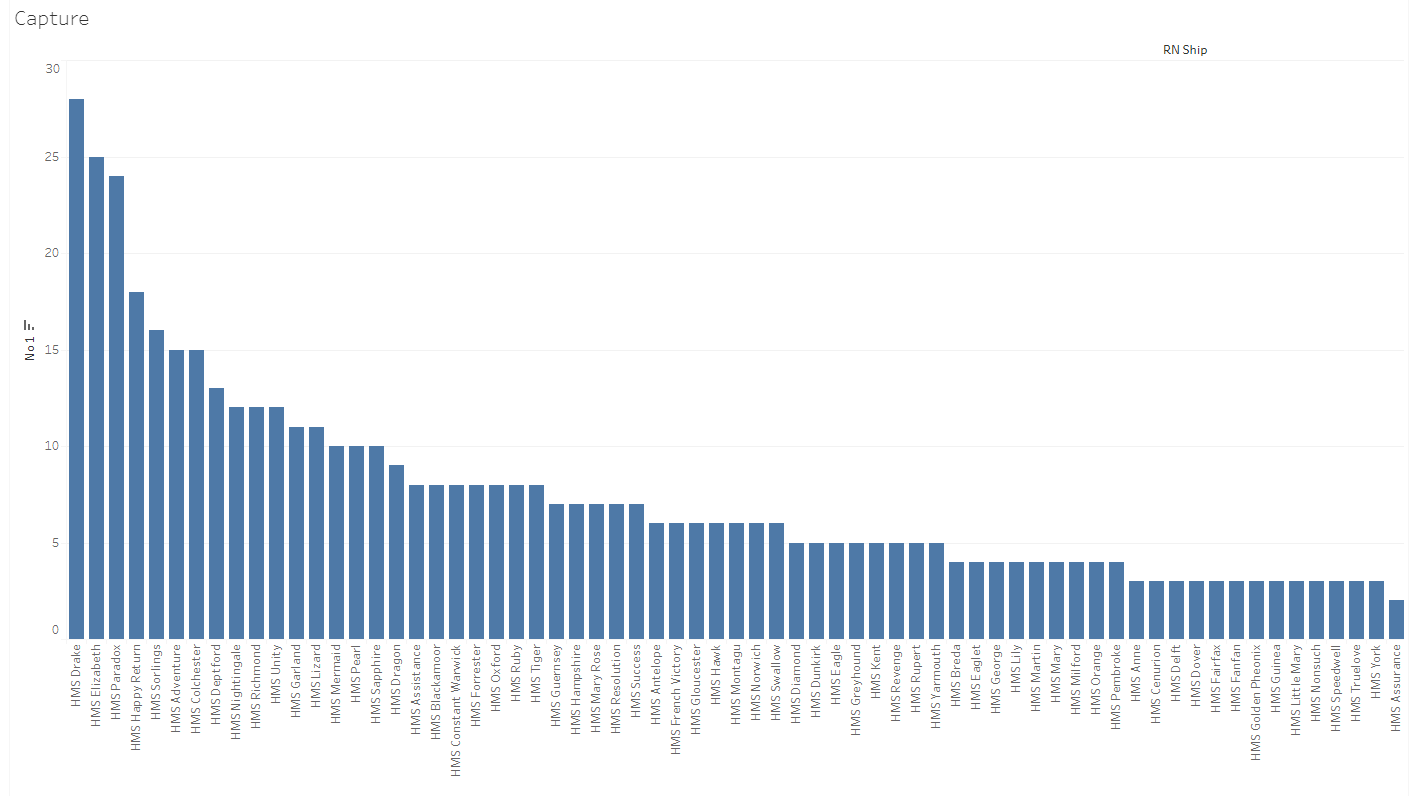
Chart showing the most successful Royal Navy ships by number of captures (Graphic produced in Tableau Public – linked to online version)
Rather than dive off into that rabbit hole I am going to stick with the data, and focus my attention on what it can tell us about the ships that were captured, notably about where they were from, and the details of their voyages.
The catalogue description generally gives the ship’s name, the name of the master, and the home port. We have to be a little careful here about the nature of the cataloguing (and the original information). For example, the “St John Baptist of Amsterdam” probably refers to a ship called the “St John Baptist” which comes from Amsterdam, but the “St Anthony of Padua” may well be the full name of the ship, and have nothing to do with the Italian town.
These issues aside by extracting this information we can begin to look at where the ships captured as prize originated from. Being geographic data I wanted to display this on a map.
To start off with I decided to use Google Fusion Tables, an easy tool which lets you enter geographic information in straightforward text form and it will do the geo-coding (ie, providing names of locations with coordinates so they can be plotted on a map) for you.
The below map looks pretty good and certainly gives a fascinating new insight into where the ships captured originally came from.
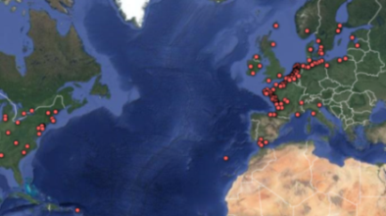
Map showing home ports of captured vessels (Graphic from Google Fusion Tables – linked to online version)
Unfortunately, however, the eagle-eyed amongst you will have noticed that a number of ships appear to have come from some unlikely locations in the United States.
The problem with geo-coding, especially of historic locations, is that there are many locations sharing the same name, and it is not always obvious to the software which one is the correct one for this situation. (For an excellent insight into some of the perils of mapping locations see this blog by my colleague Matthew Hillyard).
Thus I decided to geo-code the locations myself.
To do this I used the MMQGIS plugin in the QGIS mapping software. This is a little bit more difficult than using Google Fusion Tables, but gives you far greater control, and crucially gives you the location coordinates to enable you to use other visualisation tools.
With this information I then decided to try to map the home ports again, this time using the Tableau Public tool. As you can see below, the results are much more satisfactory, and give us a clear picture of where the ships taken as prize during the conflict originally came from.
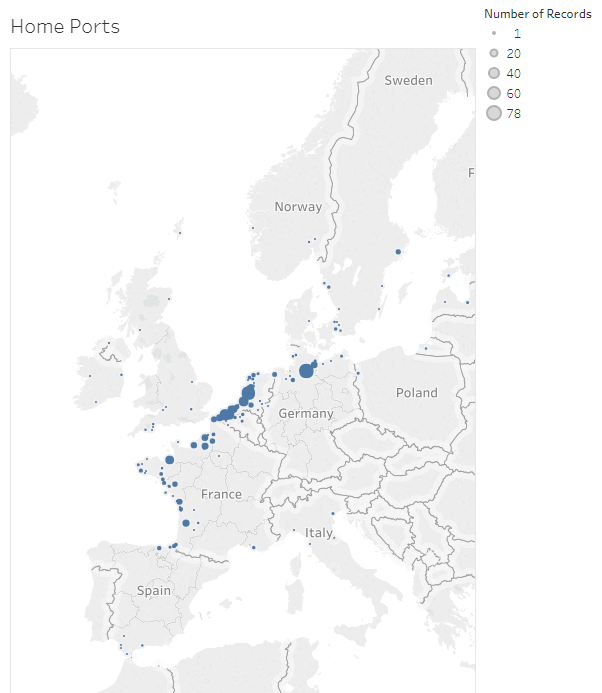
Map showing home ports of captured vessels (Graphic produced in Tableau Public – linked to online version)
Finally, I wanted to get a sense of what type of trade was being intercepted by the Royal Navy and English (and Scottish) privateers. To do this I decided to map the information from the catalogue on where the ships were bound from and to. I geo-coded these places using the same tool as before but this time decided to map it using Palladio, a visualisation tool developed by Stanford University, and designed to show networks.
The result is not perfect for visualising seaborne commerce, but still gives us a pretty good impression of the nature of the trade captured.
Most notably the vast majority of the trade is reasonably local, particularly between the French Atlantic coast and the Low Countries. There is relatively little Mediterranean or Levant trade, and very few of the prized vessels from the East or West Indies were captured.
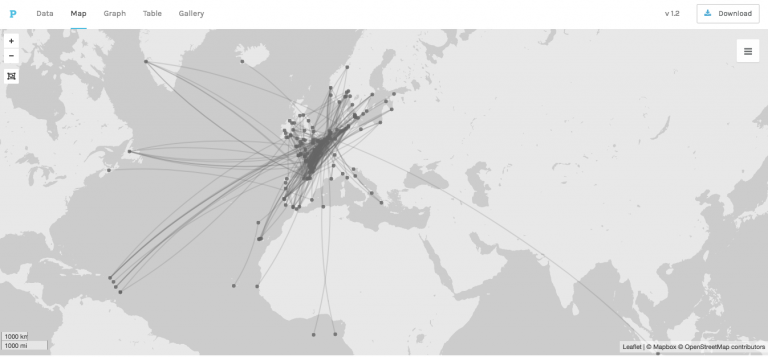
Map showing the voyages undertaken by captured ships produced using Palladio
To really develop a full understanding of the English campaign against Dutch commerce would require a considerably more in-depth analysis than I have conducted here, most likely connecting the data with further archival research.
However, I think it is clear from what I have shown that the data offers huge potential for researching this topic.
I have produced this dataset in a couple of hours without reference to the original documents. The same can be done by any researcher or student across the globe, and remember, this is all freely available to anyone who has a computer and access to the Internet.
Archive catalogues more generally offer amazing research possibilities – all that is needed is for us to stop thinking about them as merely finding aids, and realise they are in fact one of the richest historical datasets we have.
Read the previous post in this series – Catalogue as Data: the basics.
This is all very interesting and deserves to become even better known to folk interested in migration studies in the 17th century, perhaps especially in America.
The descriptions are not always accurate, for example there is Vlissingen (in the Dutch Province of Zeeland) which in England was described as Flushing and not to be confused with Flushing in Cornwall. Of course Belgium didn’t exist at the time but is there any other way you could do that and of course many towns in Zeeland did not exist and water covered a lot of Zeeland at the time.
Thanks for this excellent use cases!
I guess what you map as Danzig (north of Lübeck, Germany) is Sierksdorf today. I don’t know whether it was called Danzig in the past, but there is (another?) famous Danzig which is now Gdańsk, Poland.
I have a question: is there a way to provide feedback to the catalog data? So now you cleaned it a bit, did some corrections, map historic names to modern name and coordinates, maybe also fixed some other things you did not mention in the article. Is there any procedure in the archive to ask these improved data back, and fix the original records?
One of my Dutch ancestors was a Constable in New Amsterdam, Constable VanCovenhoven. In Later years the name was changed to Conover. A Conover fought Gen Burgoyne at Fort Ticonderoga with the Green Mountain Boys. He was wounded in the Battle and escaped across a lake. His wounds was healed by blood leaches by placing his leg over the side of the boat as they were escaping Burgoynes ensuing Redcoats. Conover settled in New Jersey. One of his descendents Joseph Conover was killed at the Battle of Brandy VA while engaging Gen Longstreet. He was shot off his horse whilst charging a picket line. Longstreet was later engaged by Armstrong Custer at the Battle of Gettysburg. Gen Lee was distraught that Longstreet’s arriving late may have been the reason they lost Gettysburg.